War support in Russia by demographic group

Since we began collecting data on May 19, support within the Russian population for the "special military operation" (SMO) in Ukraine has been high--and strikingly consistent--at around 74%. While revealing on its own, this average obscures interesting variation across demographic groups. Our data show that men, older, and less educated people tend to support the SMO more than women, younger, and more educated people. Still, the majority of Russians in each of these groups express support for the SMO.
Men support the SMO more than women
On average, 77.8% of men claim to support the SMO. If we include "don't know" (DK) and "prefer not to answer" (NA) responses in our analysis, the level of support among men is 71.6%, with 20.4% opposing and 8.0% DK/NA.
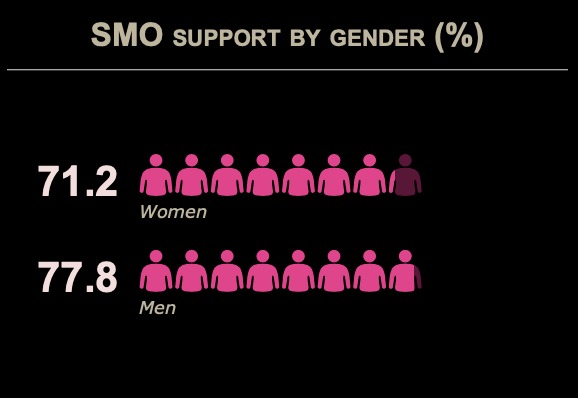
Support for the SMO among women is lower, at 71.2%. Including DK/NA responses in the denominator, we find that 58.9% of female respondents express support for the SMO, 23.9% express opposition, and 17.2% either don't know or prefer not to answer. It is worth observing here that not only do women support the SMO less than men, but they are also much more likely to decline to answer the question. We plan to analyze nonresponse patterns more closely in future blog posts.
Older people support the SMO more than younger people
Support for the SMO also appears to increase with age. Among respondents aged 18-24, which compose around 7% of our sample, support is at 59.4%. For each successive age group, the average level of support is higher: 70% for 25-34 year-olds, 75.3% for 35-44 year-olds, and 76.2% for 45-54 year-olds. Among respondents who are older than 54 (20% of our sample), average SMO support reaches 78.9%.*
People without higher education support the SMO more than those with a university degree
Among respondents who have a university degree, support for the SMO is 72.5%; among those without a university degree, support is 75.4%. Although this difference is not large, it is statistically significant. The difference is even larger if we consider the most highly educated Russians: only 54.9% of respondents with a postgraduate degree expressed support for the SMO. However, it is important to note that this is a very small fraction of our respondents--only 2.8%.*

These basic descriptive statistics show that although the vast majority of Russians support the SMO, this support is not evenly distributed across the population. In future analyses, we plan to dig into these trends in greater detail to understand their causes and consequences. It will also be important to conduct a more thorough analysis of trends in nonresponse to questions about sensitive topics like the SMO.
*DK/NA responses are excluded, except where otherwise noted.